TL:DR – the Excel add-in combined with Power Query is the ad hoc reporting tool you’ve been looking for. And it’s free.
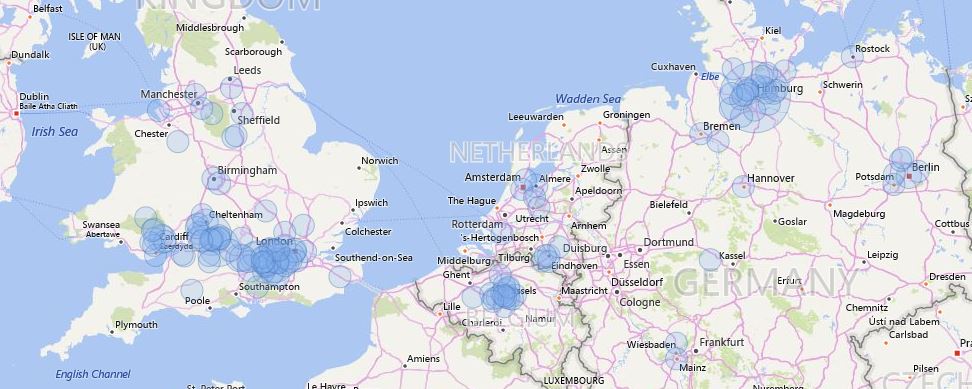
One of my favourite things about Talent is the analytics dashboards that are published in most of the workspaces. No sooner have you entered your first worker records than these great visuals start to light up and show you things about your data you’d never taken the time to notice before. Gender pay gap reporting? No problem. There’s an embedded PowerBI dashboard for that. Map view showing how geographically dispersed your workforce are? Filtered by job and legal entity? Easy peasy. No setup required.

So there’s a great set of standard analytics embedded right into the product and available from day one. If you want to go off-piste, and start creating your own reports, there are a few different options. When we work with customers on this we’re looking at:
- What data do they need to be able to report on
- What’s the budget for their analytics workstream
- What skills and capabilities do they have in house
It’s important to remember here that the data which supplies the Core HR element of Talent (basically the bit which holds all your worker data, their compensation, employment dates, demographic info like age and location) is stored in what for the purposes of this post we’ll call the AX database (AXDB). The AXDB is closed – which is to say you can’t connect directly to it as a data source in the way that you can with, say, Finance and Operations or older versions of AX. However, the AXDB shares some of its data with the Common Data Service (CDS). When you deploy Talent, you have to deploy it into an environment with a CDS instance, and Talent will then sync certain entities with the CDS. CDS is open – so you can connect to it with the reporting tool of your choice (preferably PowerBI) and start to create reports. CDS is the long term option for creating custom reports from Talent. Be aware though – at the time of writing, not every data point which exists in the AXDB is being synced to CDS. Microsoft are working on adding more and more entities, prioritised by customer need – but right now (March 2019) you will still find that some of the entities you need to report on are not available.
In that case then, you need to find another solution.
If you’ve got the budget for it, the most robust, long term answer is to use the data migration framework (DMF) bring-your-own-database features to push data from the AXDB directly into a 3rd party database. Your data geeks can then build all the views and measures you could ever wish for, and you can write reports to your heart’s content.
If you don’t have the luxury of a data team though, there is another way. It’s quick, it’s cost-free, and it’s really, really dirty – but it works a treat. All you need is an appropriately licensed and credentialed user and a relatively recent version of Excel.
First of all – identify the data entities that contain the data you need to report on. There are lots of different ways to do this, and it can be a bit of trial and error. My preferred method is this:
- Open the form which contains the data you want to extract. Let’s say I want to report on leave requests. I go into the Leave and Absence workspace, go to the links page, and open the leave requests link.
- Find a field that you know needs to be in your report – for example, start date. Right click on start date and you’ll see a ‘Form Information’ option (if you don’t see it, you probably don’t have sufficient security roles. Contact your administrator). Hover over form information and the ‘Form Name’ option will show up. Click that.
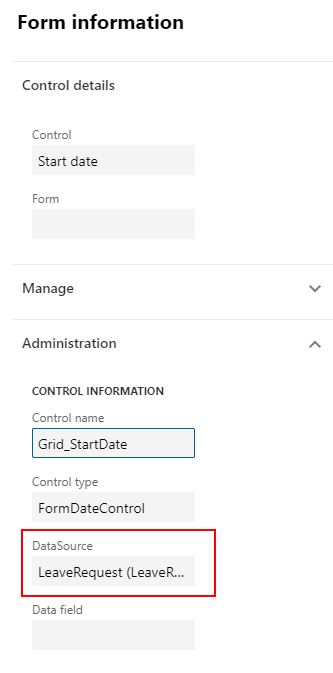
- When you click the form name, a form info slider will come in on the right hand side of the screen. At the bottom of that form is an ‘administration’ tab, which contains a field called ‘DataSource’. That field gives you a clue as to the name of the entity you will need to extract in order to report on this data.

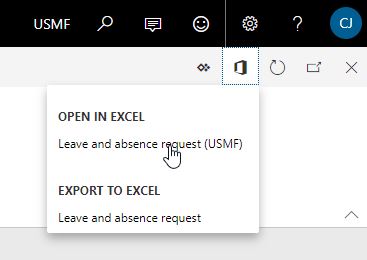
Next, you need to open that entity in Excel. This process is described in this post. You’ll need to be running Excel 2016 or later for this to work. Basically you hit the Office icon in the top right hand corner of nearly every list page, and select the ‘Open in Excel’ option. If you don’t have that option, you probably don’t have the right roles, so speak you your system admin. Make sure you’ve used the ‘Open in Excel’ option, because you’ll then retain the connection to the source data, meaning your report can be periodically refreshed if you want to be able to repeat it on a daily, weekly, monthly (etc…) basis, without starting from scratch every time.

When you’ve successfully connected Talent to Excel, carry on adding new entities to the same spreadsheet until all the source data you need is in the same workbook, preferably with each entity on a new worksheet (personal preference, I just find it easier that way). Every time you need to pull new data from source and update, you can just use the refresh feature on the add-in.
But – naturally, you don’t want all this data in separate tables. What you want to do is dice it and slice it and pull it together, either to make a nice visual or purely to give you a good old fashioned transactional list report. And this is where Power Query comes in.
If you do even a moderate amount of your work in Excel and you’ve never used Power Query, you’re missing out. It’s a data manipulation tool that was available as a download for the 2010 and 2013 versions of Excel, and available out of the box with 2016 or later. If you’ve ever drowned in nested VLOOKUPS, debated the relative merits of INDEX and MATCH, or bemoaned the lack of an option to create pivot tables from multiple data sources, then this is the tool for you. It’s not even new any more, so get on it. There are a whole load of fantastic resources available online to help you learn it, and the official Microsoft page is a good place to start.
I’m not intending to write a step by step guide on how to use this seriously underestimated tool, because there’s plenty out there already. So I’ll leave you to do your own digging. But in a very short space of time, you’ve now extracted your data from the Talent database (AXDB) in a way which is refreshable, and got an ad hoc query tool that will allow you to mash up that data to give the output you need. You haven’t even needed to buy any additional licenses or install any new products.
@Tom, great article. Something I will start to look at for POC’s going forward, just to showcase capability.
Slightly off topic but if only we could also copy environments… 😉
Thanks Justin – yep, Power Query is a really great tool and seriously under-utilised (I know so many serious Excel geeks who don’t even know it exists). The environment copy thing – yes, definitely. Let’s catch up at some point in the next couple of weeks and see what we might be able to do to help with that one.